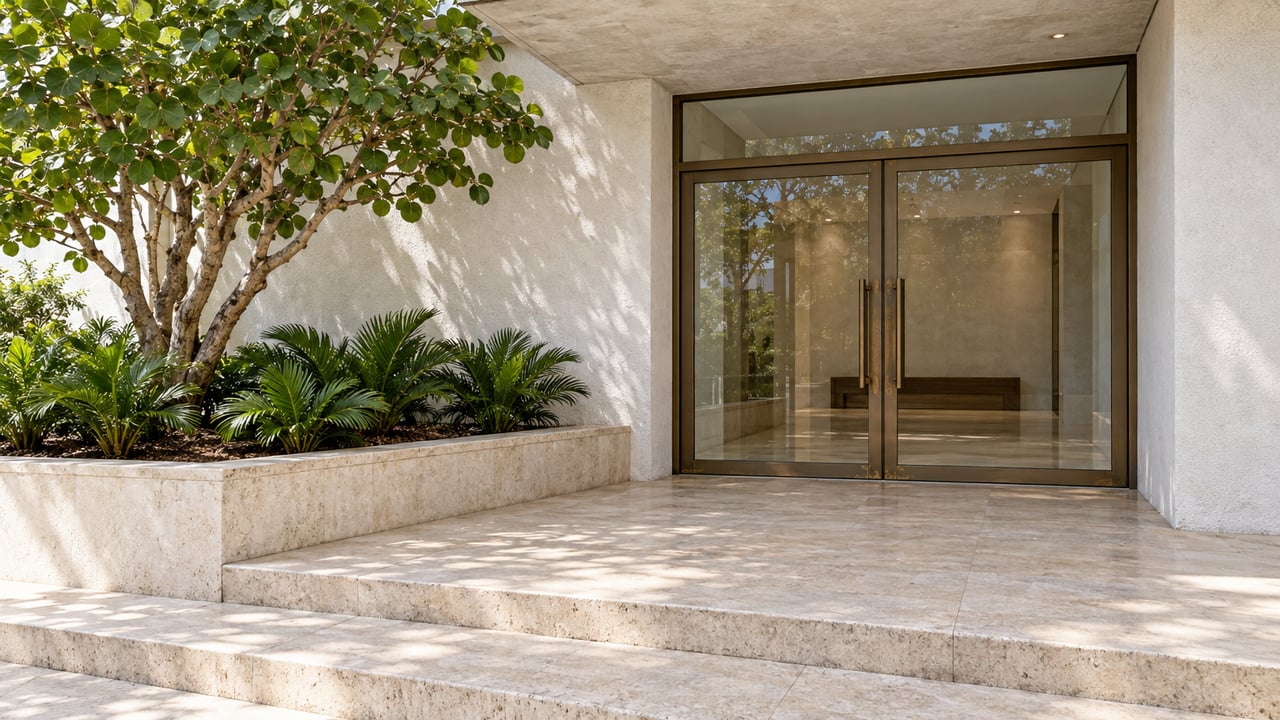
On July 23, an application to build a one-story house of about 4,368 square feet at 758 NE 95th Street went before the Miami Shores Planning & Zoning Board. The plans showed three bedrooms, four and a half baths, an exercise room, a two-car garage and a pool. The owner of record was Casa Lume Venture, LLC. When the board's October 22 agenda came out, the item was still listed as tabled. The plans had been revised to about 4,299 square feet, with an office area added.
Over the same months, the median Miami Shores home went under contract in nearly half the time it took a year earlier. These two facts are related. In Q3 2026, the Miami Shores homes that gained the most were neither the trophy homes nor the cheapest ones. They were the homes in the middle of the range, and that middle range is also where the plans for the village's next houses are being filed.
The median moved five times as much as the average
Florida Realtors' municipality-level report for Q3 2026, released October 16, counted 42 single-family closings in Miami Shores Village, 20% more than in the same quarter of 2025. The median sale price for July through September was $1,440,000, up 19.7% year over year. The average sale price for the same quarter was $1,618,260, up only 4.4%.
The gap between those two numbers tells you where the gains were. A handful of very large sales would raise the average faster than the median. In Miami Shores the opposite happened: the middle sale rose by nearly a fifth while the average barely changed. Most of the movement came from ordinary village houses selling for more than they did a year earlier.
Forty-two sales is a small sample, and a single quarter's median can be skewed by which houses happened to close. That is why the median should be read alongside the speed and supply figures below. All of them point the same way.
| Miami Shores Village, single-family, Q3 2026 | Figure | Change from Q3 2025 |
|---|---|---|
| Closed sales | 42 | +20.0% |
| Paid in cash | 18 | +12.5% |
| Median sale price | $1,440,000 | +19.7% |
| Average sale price | $1,618,260 | +4.4% |
| Dollar volume | $68.0 million | +25.3% |
| Share of original list price received | 94.7% | +8.5% |
| Median time to contract | 31 days | -47.5% |
| Active listings | 48 | -29.4% |
| Months' supply | 4.0 | -33.3% |
Source: Florida Realtors Q3 2026 Local Residential Market Metrics, published by MIAMI Realtors.
Sellers gave up less, and buyers had less time
In Q3 2026, the median Miami Shores home went under contract in 31 days, nearly half as long as in the same quarter a year earlier. Sellers received 94.7% of their original list price, 8.5% more than in Q3 2025. Both numbers mean the same thing for a buyer. Waiting for a price cut used to give a buyer room to negotiate, and in the third quarter that room was much smaller than in 2025.
Supply explains part of it. At the end of the quarter, 48 homes were listed for sale, down 29.4% from a year earlier, equal to 4.0 months' supply, a third less than in Q3 2025. With more buyers closing and fewer houses listed, the median rose. Because the average rose so much less, the competition was clearly concentrated around the typical sale price rather than at the top.
Cash buyers are a large part of the pool. Eighteen of the 42 Miami Shores closings in Q3 2026 were paid in cash, about 43%. Across Miami-Dade County, 617 of 2,591 single-family closings were cash in the same quarter, about 24%. A financed buyer here has a much better chance than average of competing against an offer with no financing contingency.
The county as a whole stayed flat. Miami-Dade single-family closings slipped 0.8% in Q3 2026 and the county median rose 3.8%, to $685,000. Miami Shores rose sharply during a quarter when the wider market barely moved.
What is being proposed on the lots
The Planning & Zoning agendas show what at least some owners plan to do with their land. Between July and September 2026, the board's agendas listed five new single-family homes:
| Address | Proposed size | Agenda |
|---|---|---|
| 758 NE 95th Street | about 4,368 sq ft, later revised to about 4,299 | July 23; tabled as of October 22 |
| 418 NE 105th Street | about 7,280 sq ft | July 23 |
| 1210 NE 97th Street | about 4,892 sq ft | September 24 |
| 46 NE 101st Street | about 3,770 sq ft | September 24 |
| 482 NE 93rd Street | about 7,448 sq ft | September 24 |
The September 24 agenda describes the 1210 NE 97th Street house as two stories with four bedrooms, five and a half baths, a two-car garage and a pool. The owner is listed as 1210 NE 97, LLC, and the applicant as Matias Daroch of MIK Architecture. Each of these is a proposal on an agenda, not a finished house. Several are owned through limited liability companies named for the project or the address.
Most of these applications are not on the bayfront. NE 93rd, 95th, 97th and 101st Streets run through the interior of the village, among the kinds of houses that make up most of the quarterly closings. The village's next generation of houses is being planned on the same type of lot that drove up the median.
Other owners are choosing to add on rather than rebuild. On the September agenda, 73 NE 99th Street was listed with a façade modification, a new roof structure and an addition of about 291 square feet to an existing one-story house. In October, 94 NE 102nd Street came forward with a garage conversion of about 292 square feet. Some owners are rebuilding from the ground up and others are adding a room at a time.
Miami Shores against its two closest neighbors
The same Q3 2026 report covers the two villages next door. El Portal had 14 single-family closings at a $1,225,000 median, with homes going under contract in a median of 21 days and selling at 95.6% of the original list price. It ended the quarter with 5.4 months' supply. Biscayne Park had 11 closings at a $1,227,500 median, with 39 days to contract, 90.4% of original list price and 6.0 months' supply.
In Q3 2026, Miami Shores' median was about $215,000 above both neighbors, and it had the least supply of the three. El Portal sold faster, but more of its homes were still on the market at quarter's end. Buyers comparing the three villages are seeing three markets that move at different speeds. Miami Shores had the fewest homes available, which helps explain why its median rose so much faster than its average. Our El Portal neighborhood page and Miami Shores neighborhood page cover the streets behind these figures.
Questions buyers ask about this quarter
Is the 19.7% median increase the value change for my house? No. It is the change in the middle sale among 42 closings in July through September 2026. The average rose 4.4% over the same period, and an individual house depends on its own comparable sales. A home valuation based on nearby closings gives a better number for a specific address.
Are the new homes on the agendas approved? The agendas show proposals going before the Planning & Zoning Board. As of the October 22 agenda, 758 NE 95th Street was still listed as tabled. The agendas linked above list each item's status as of each meeting date.
Does a buyer need cash to compete here? In Q3 2026, 18 of 42 Miami Shores sales closed in cash. More than half of the quarter's sales were therefore not paid in cash. A financed buyer can compete, but should expect that a cash offer may be on the table for the same house.
If you are weighing an older Miami Shores house, either as a home to renovate or as a lot to rebuild on, The Halda Group at Bryan Halda can price it against the quarter's closings and the plans now on file with the village, so your offer accounts for both. Let's Connect.